As you saw in the animation, mRNA from the tissue sample hybridizes (sticks to) to the complementary DNA on the microarray. The more mRNA present in the tissue sample, more mRNA will hybridize to the DNA spot. Because the mRNA has a red fluorescent label, more mRNA means a brighter red light when that spot is scanned with the laser.
Typically, a microarray has over 200,000 DNA spots. In this photo of an actual microarray, the mRNA has been labeled with a green fluorescent label. A brighter green light indicates more mRNA is present.
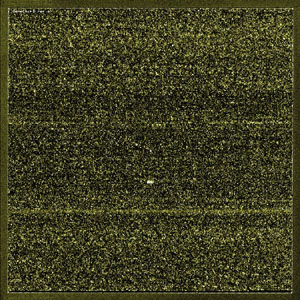
Scanned zebrafish microarray image
Scientists use very sophisticated statistics software and powerful computers to analyze large amounts of data. They can spend over six months analyzing data from one experiment.
In this case, we will only analyze a small portion of the microarray that has 25 DNA spots.
Compare the microarray gene expression patterns to the experimental sample in the image below by clicking on the arrow.
Which chemical class best matches the pattern from the experimental sample? Click on the select button to see if you are correct. Remember, you aren't looking for an exact match, just the closest match.
If having trouble viewing, go here.